CRT
Critical rail temperature threshold monitoring and prediction
Monitorering af baneinfrastruktur
RailGuard er det infrastrukturfokuserede koncept til bane- og spormiljøer hvor trends, afvigelser og tilstandsændringer kræver opfølgning.
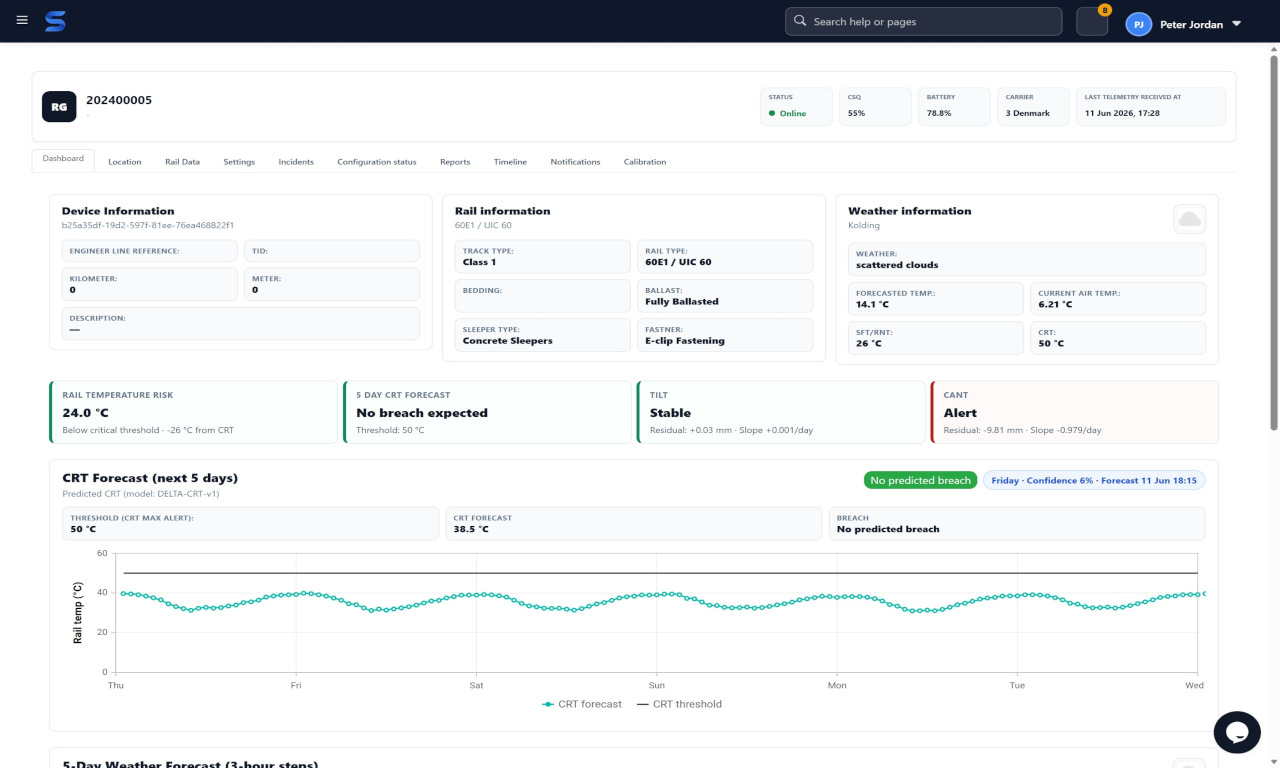
Rail temperature, tilt and cant dashboard
See current rail temperature risk, forecast breach status, tilt, cant and weather context in one operational view.
RailGuard
The business value is not just knowing the temperature. It is knowing which locations may need inspection, which alerts matter, where weather creates risk, how field teams should prioritize the day, and how infrastructure condition affects cost and reliability over time.
CRT
Critical rail temperature threshold monitoring and prediction
5 day
Weather forecast context for rail temperature risk
24/7
Track-side condition monitoring for selected locations
1 flow
Alert, inspection, service visit, report and cost history in Sepolo
Kunder i drift
PointGuard og RailGuard understøtter allerede rigtige banemiljøer, hvor målinger skal omsættes til bedre service- og vedligeholdelsesbeslutninger.


RailGuard er tænkt til specialiserede banemiljøer. Målinger som railtemperatur, geometri, hældning eller andre tilstandsværdier kan kobles ind i en struktureret vedligeholdelseskontekst.
Saml tilstandsværdier der viser hvordan infrastrukturen udvikler sig over tid.
Brug historiske signaler til at se mønstre der bør vurderes før de bliver driftsforstyrrende.
Kobl raildata til aktivgrupper og vedligeholdelsesplanlægning i Sepolo.
RailGuard shows rail temperature against CRT thresholds and helps identify when a monitored section may need operational attention.
Weather and temperature predictions help teams see whether a future threshold breach is likely before the day becomes operationally stressful.
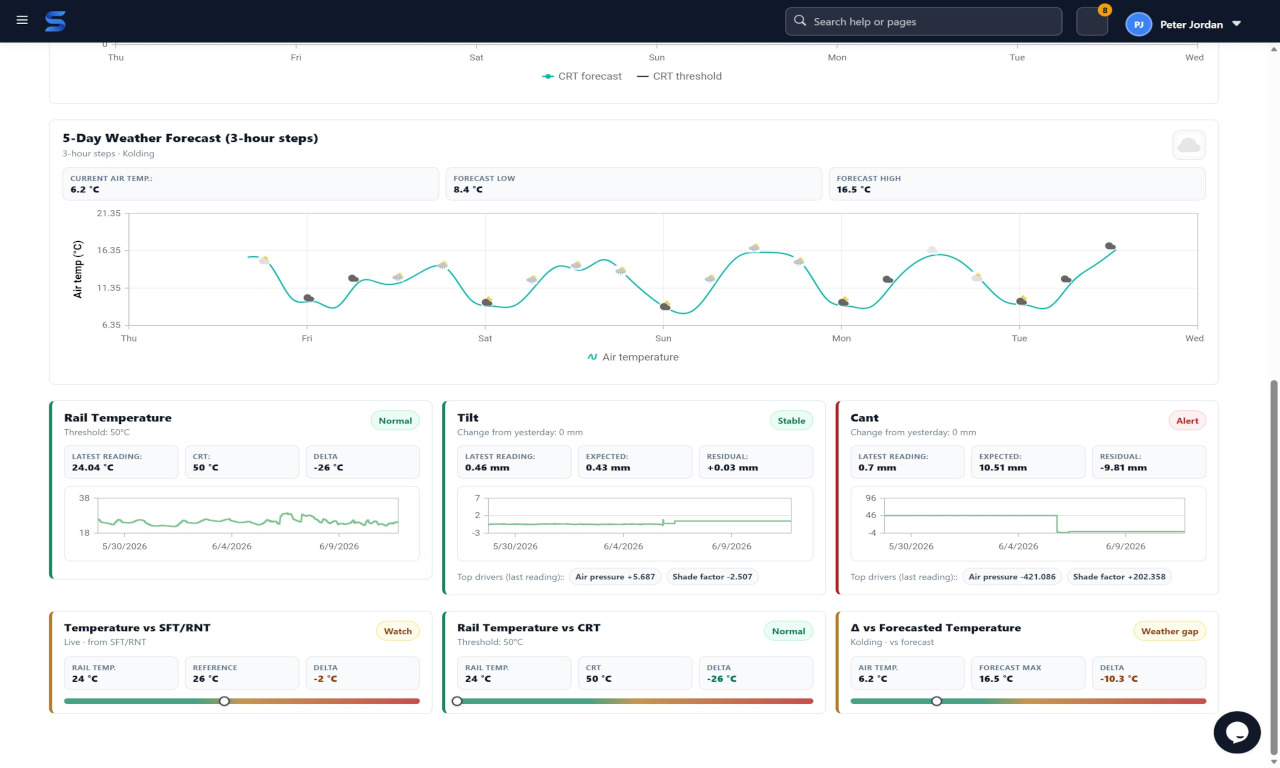
Expected and measured values can be compared so engineers see whether track-side geometry indicators are stable or changing.
Air temperature, humidity and local weather conditions help explain why a rail section is behaving differently.
RailGuard can highlight locations that are normal, on watch or in alert state so field teams know where to look first.
Measurements, incidents and service follow-up stay connected to the same rail location for long-term asset learning.
RailGuard
RailGuard visualizes current condition, forecast risk and track-side indicators so maintenance teams can make decisions before a location becomes a disruption, safety concern or speed-restriction conversation.
See current rail temperature risk, forecast breach status, tilt, cant and weather context in one operational view.
Use forecasted air and rail temperature to understand when monitored locations may need attention before conditions deteriorate.
RailGuard is installed as a monitored rail location in cooperation with the railway team so sensors, thresholds and operating context match the infrastructure.
The device reports rail temperature, environmental values and track-side condition indicators into Sepolo.
Sepolo combines current readings, historical trends and forecast data to identify abnormal or risk-building conditions.
Locations can be marked normal, watch or alert, and follow-up can be routed to the right maintenance or operations team.
Inspection, findings, service visits, cost and future maintenance planning stay attached to the monitored rail location.
RailGuard
Earlier visibility into temperature, tilt, cant and environmental trends helps teams inspect before a condition turns into a restriction or urgent response.
Watch and alert states make it easier to decide which track-side locations deserve attention first.
Rail temperature is easier to understand when weather forecast, air temperature and humidity are visible next to the rail data.
Sepolo connects RailGuard alerts to inspections, service visits, technician findings and cost so the asset history becomes useful over time.
Dispatch, engineer utilization and service planning can be driven by measured risk instead of calendar checks alone.
The same track-side monitoring model can support future pages for temporary works, construction zones and high-risk rail-side activity.
RailGuard
RailGuard is for operators who want track-side condition monitoring to become actionable, not isolated. The goal is to connect measurements, trends, predictions, alerts and field work in the same system so engineering, operations and finance can see what happened, what was done and what it cost.
Mere struktureret overblik over kritisk infrastruktur
Bedre planlægning af vedligehold før problemer vokser
Forbindelse mellem railtelemetri, serviceudførelse og aktivhistorik